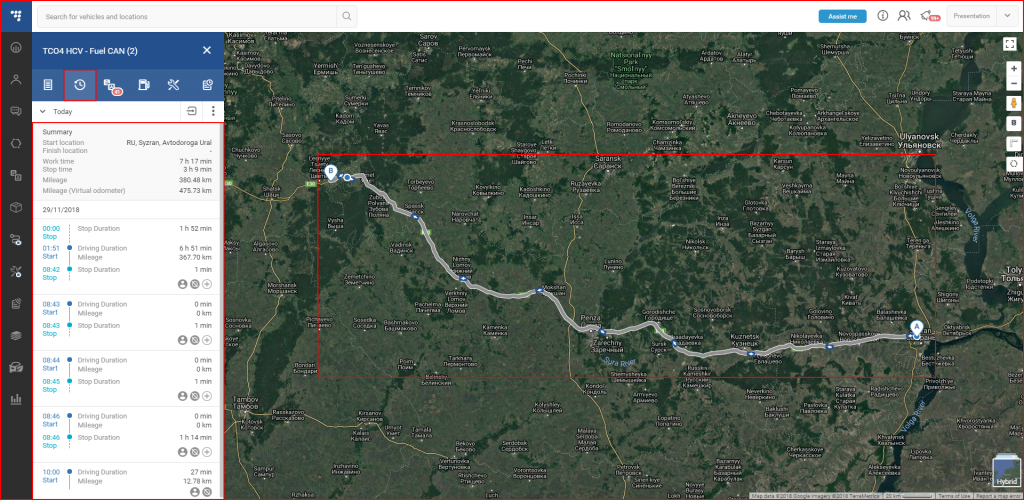
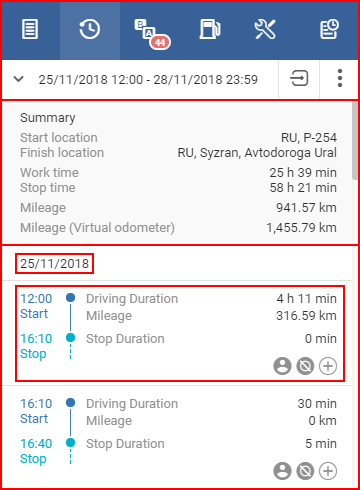
History – opening this panel will automatically update the map with the latest travel history for the selected vehicle and a short travel analysis will be displayed and well as the route of the vehicle.
Note
If the route contains a dashed line, it means that vehicle ignition was off on dashed part of the route.
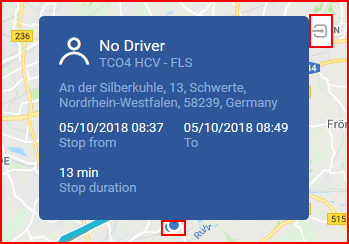
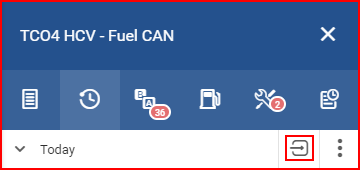
Arrows show the direction the vehicle was driving towards, while dots represent stops. Clicking an arrow or a dot will display additional information about the vehicle at that point. Clicking the icon on the top of the pop-up will enter the “Analyze by coordinates” menu, described below in this section.
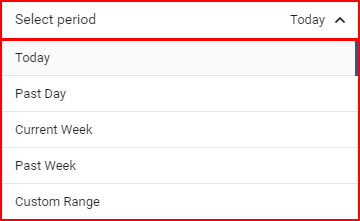
The default time period is set to the current day. This can be changed by clicking the “Select Period” which will open a drop down list, where the user can select the preferred time period. There are several preset time periods, and a custom time period. The minimum period is 1 day. The currently selected time period is highlighted in a darker shade of grey and a blue bar at the right side of the time period name. If the user selects “Custom range”, a calendar selection menu will appear in which the user has to select the custom time period.
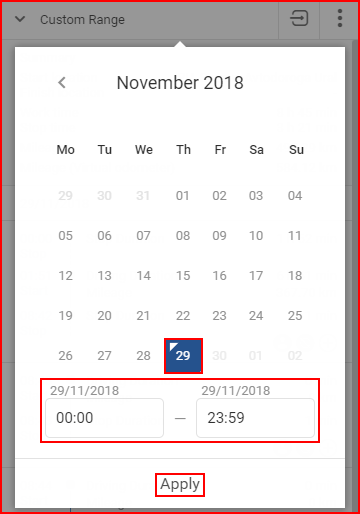
In the selection menu, the currently selected time period is highlighted in blue. The current day is highlighted by a small red blue triangle above the date. If the current day is selected in the time period then the triangles’ color will be inverted to white. To select a preferred date start by clicking on the end or beginning date (there is no priority in choosing) and afterwards click the opposite (end/begin) date. Afterwards the user can specify from which hour of the begin date until which hour of the end date to display the history. To apply the changes, the “Apply” button must be clicked, otherwise the changes will not be saved.
The maximum time period length is 6 months. To close the panel the user must click anywhere outside the calendar window. The time period can be modified at any time by simply clicking on it. For any selected time period, a summary will be displayed, showing general information such as:
- Trip start location;
- Trip end location;
- Working time (time driven);
- Stop time;
- Mileage (total driven distance);
- Mileage (virtual odometer) (displayed only if configured, will not be displayed if mileage is configured using input ID 65).
Below the summary, are the trip details. Trips are first grouped by days, starting from the oldest date to the latest. Then trips are separated by the event logic. The trip starts when the ignition is turned on and ends when ignition is turned off. Clicking on a trip in the list will highlight and zoom in on it on the map, clicking the trip again will return the map to the trip overview.
Note
Trip details are only displayed for a period of up to one month.
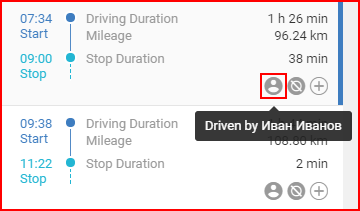
On the bottom right of each trip, there are three circles. Hovering over the first circle will display the name of the driver during that trip.
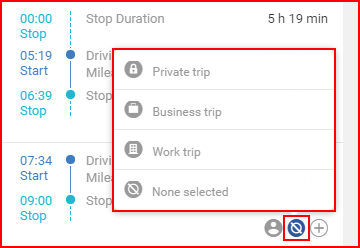
Hovering over the second circle will display the type of the trip. Clicking it allows the user to select the type of the trip (private, business, work or none).
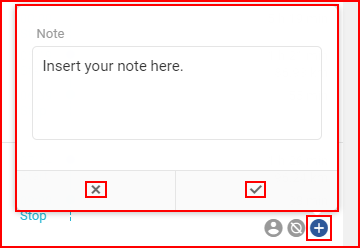
Clicking on the third circle allows the user to add notes related to the trip. Click on the tick in order to save the note. Click on the ‘x’ symbol to discard it. In order to remove a saved note, click on the circle again, delete the text, and save the note. Notes and trip types will be included in reports.
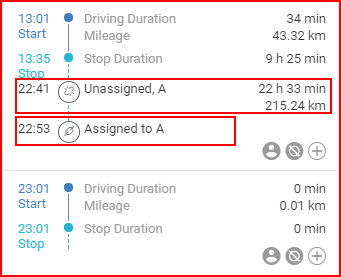
Additionally if the history for a trailer is selected, the user will be able to see when and to which vehicles was the trailer assigned, as well as total time and distance spent attached to a vehicle. The total time and distance in attachment is displayed at the detachment event. Attachment events are shown as links, while detachments as broken links.
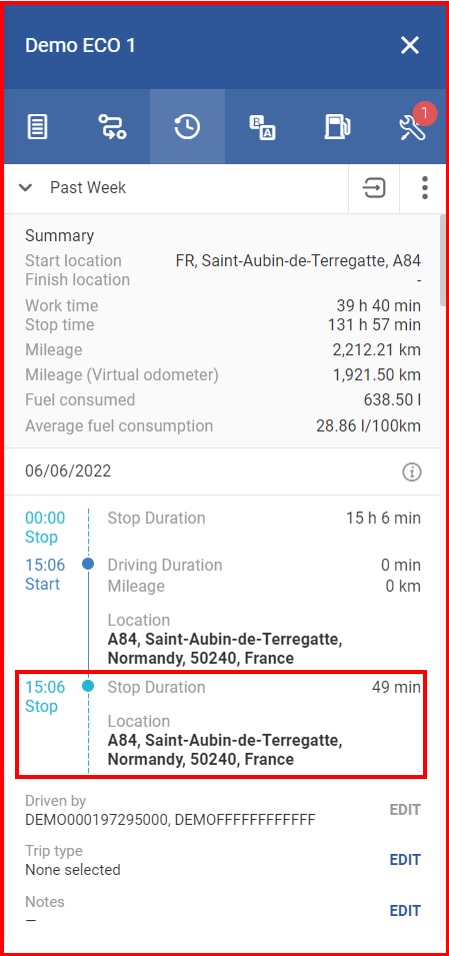
There is an ability for a user to see addresses of objects stop locations in trips history section.
Note
Stop location address feature is not included in any plan. Please contact your sales manager to order and enable this feature.
History of multiple vehicles
There is a possibility to view the history data of several vehicles at once. There are two ways to do so:
- Clicking “History of multiple vehicles” in the fleet status panel;
- Clicking the three dots in the history panel as shown in the image below.
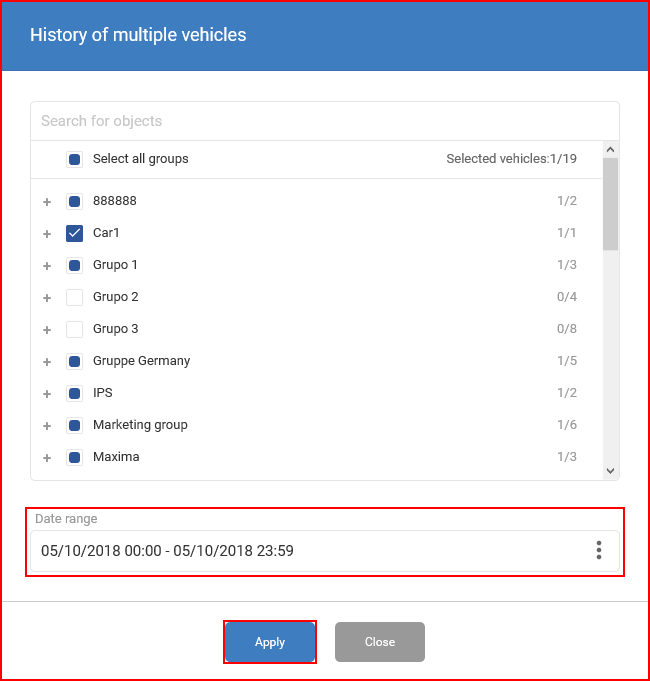
A selection window will open with all vehicles and their groups. In order to select a vehicle/group, the user has to mark the checkbox next to it. Individual vehicles can be selected from a group by clicking the plus sign next to it. Marking the checkbox next to “Select all groups” will select/deselect all groups and their vehicles. There is a search bar present, the list is updated automatically with each entered letter.
The maximum amount of vehicles that can be selected is 30. After the vehicle selection, the user must select the time period for which the data will be displayed. The maximum time period for which data can be selected is two weeks. After selecting the time period, the user must click the “Apply” button.
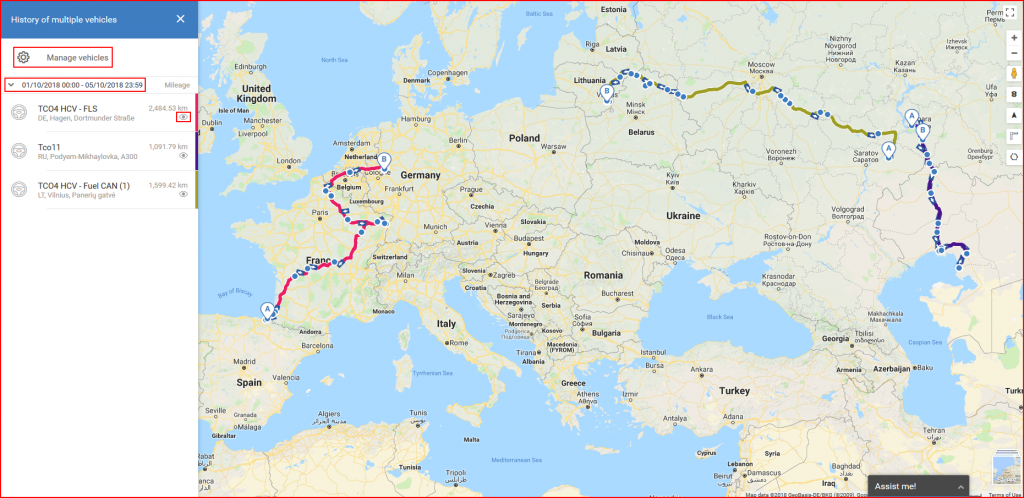
After clicking the “Apply” button, the user will be taken to the “History of multiple vehicles” window. One by one, the routes of each vehicle will be drawn on the map. Each route has a different color, the color is also displayed next to the vehicle name in the panel. Clicking the eye icon will hide the selected vehicle’s route from the map.
The time period for which the history data is displayed is shown above the vehicle list. Clicking the time period will open a drop-down list identical to the one in the History panel. The vehicles for which data is displayed can be changed by clicking the “Manage vehicles” button, it will open the “History of multiple vehicles” window.
Analysis by coordinates
The “Analyze by coordinates” button is situated to the right of the period selection.
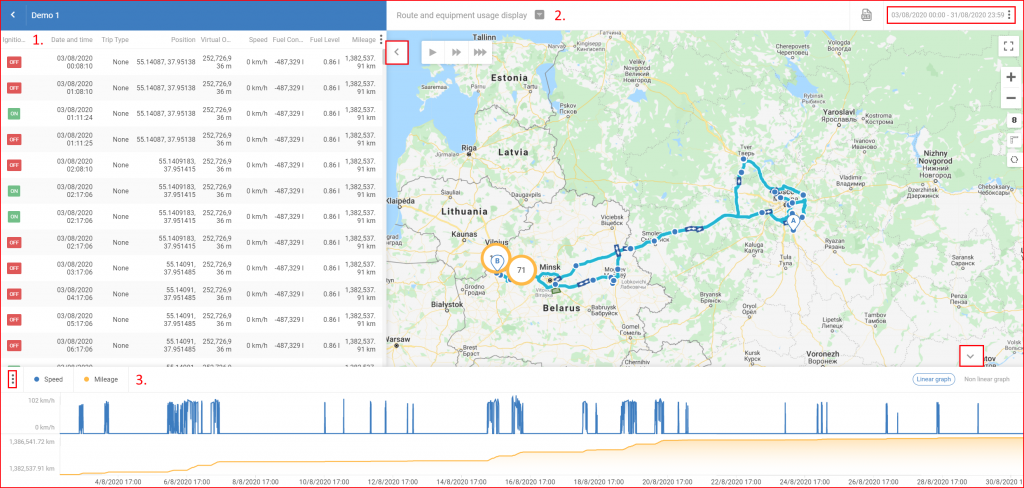
Clicking this button will open a more detailed analysis for the previously selected trip period. The time period can also be changed in the date selector on the top right part of the window. It functions exactly the same way as the date selector described above in the History panel. The overview window can be separated in to three main parts, which will be described separately:
- Details – can be hidden by clicking the arrow icon (shown on the picture below);
- Map display;
- Visual graph – can be hidden by clicking the arrow icon (shown on the picture below).
All these three parts work with each other in correlation. Clicking on a row in the details section will zoom in the map, and mark the point on the graph part. The same works in reverse order.
Details – shows basic information about the vehicle for the previously selected time period. The vehicle name is displayed above this section, highlighted in blue. Also to the vehicle name, the return button is located , which will return the user to the previous history overview screen.
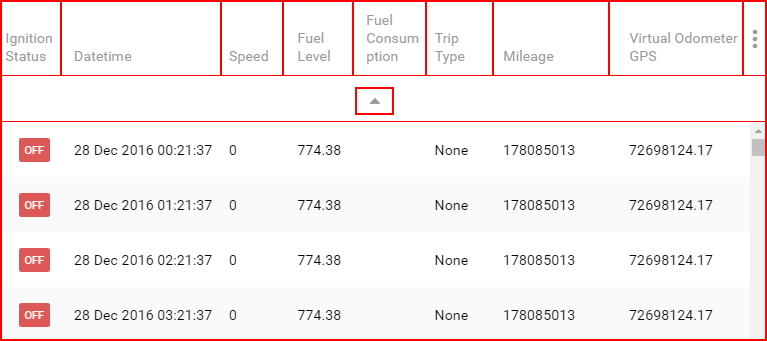
Under the vehicle name, the parameters table is located. The parameters are separated into columns and most can be changed afterwards by clicking the small three dots on the far right side of the header columns. The parameters table can contain only 250 records at a time, to show the next or previous set of 250 records, the user must click the small arrow at the beginning of the list (for previous records) or the small arrow at the end of the list (for next records).
The following parameters are shown by default:
- Ignition status – ON or OFF (Cannot be unselected);
- Date time – date and time when the record was made (Cannot be unselected);
- Speed – vehicle speed, when the record was made (km/h);
- Fuel level – vehicles fuel level when the record was made (liters);
- Fuel consumption – if configured and received by the FM device, will display the total fuel consumed by vehicle;
- Trip type – if configured in the drivers registration of the FM device, will display trip type when the record was made;
- Mileage – vehicles mileage when the record was made (kilometers);
- Virtual odometer GPS – GPS mileage when the record was made.
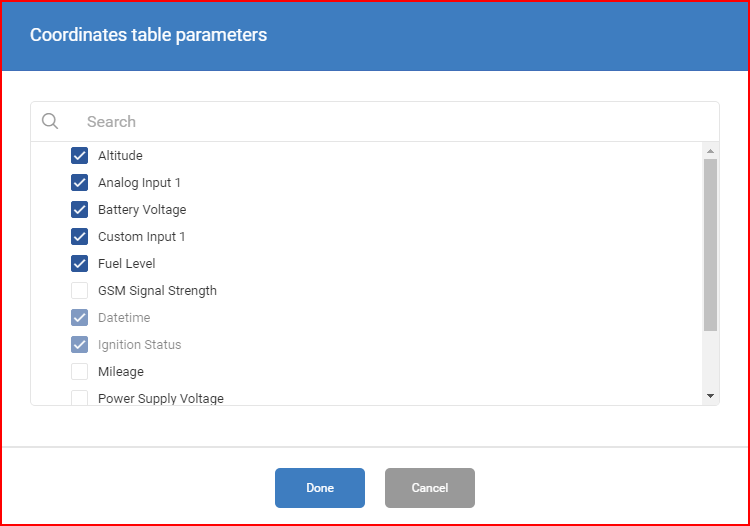
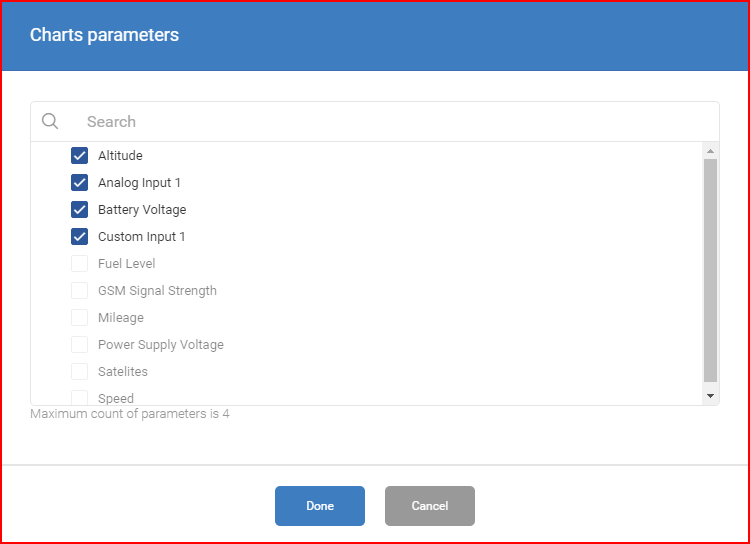
Displayed parameters can be changed by clicking the three dots mentioned earlier. Clicking them will open a new window with all available parameters for the selected vehicle.
Note
Parameters will differ for each vehicle based on the FM device configuration. Only parameters that are configured for the selected vehicle will be displayed in the list. The selected parameters are saved within the FMS database, and once changed, will display the changed parameters. If parameters that are supported by one vehicle are selected, and afterwards another vehicle is selected to display analyze by coordinates with different available parameters. The data table will display the parameters with empty fields, since the vehicle does not support them, also these parameters won’t be present in the parameters list (will not be shown as selected), but clicking the “Done” button, or simply selecting other parameters and clicking “Done” afterwards will remove the unsupported parameters from the display table.
Note
With the introduction of trailers to the FMS, new parameters for selection have become available, such as the “Shared Inputs”
Note
If Digital input is selected to be displayed in the table, if value of the digital input = 1 , then a dot will be displayed, if the value = 0, then an empty dot will be displayed.
The maximum number of selected parameters is 8. After any changes are made, the “Done” button must be clicked.
Clicking on a row in the details table, will show the position on the map, where the record was made, an example is shown further in the document.
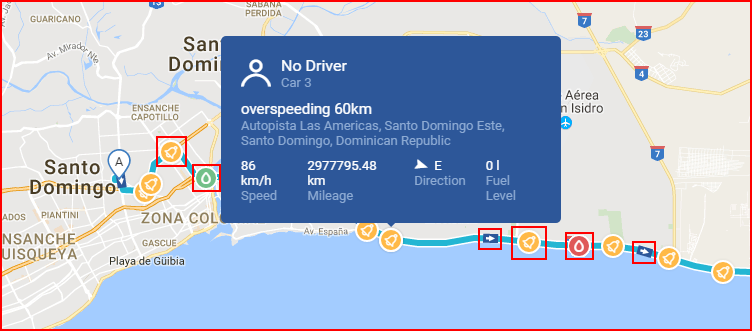
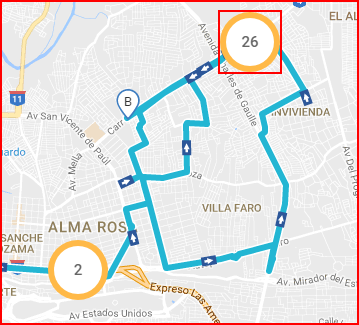
Map display – is mostly identical to the display in the history overview. The main difference is that additional information is displayed on the map and the “Playback” function. The direction of the vehicles movement is now displayed on the map in a form of arrows, events triggered during the trip are now displayed on the map in a form of a yellow bell, refuel/drain events are also shown on the map, refuels are marked with a green drop icon, drain events with a red drop icon. Clicking on any event on the map, will display additional information.
If many events are close to each other, they will be connected into clusters.
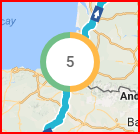
The circle color composition will depend on the type of event summed up in the cluster. Currently the are three color indications:
- Yellow – general events;
- Green – refuel events;
- Red – drain events.
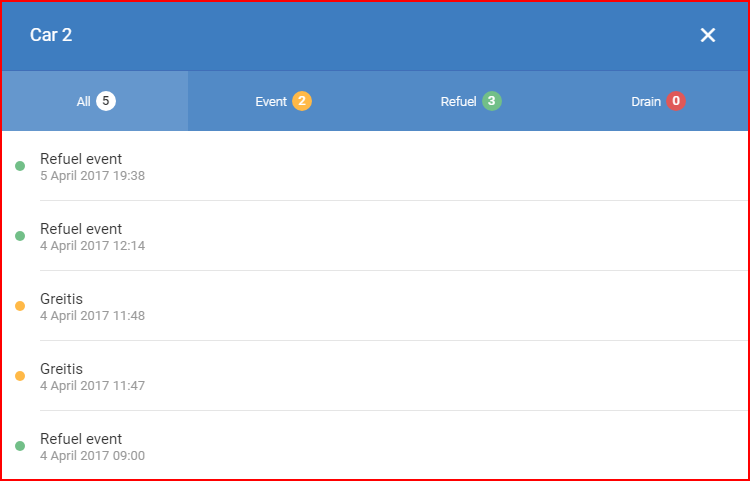
Clicking on a cluster will open a overview window, showing all the events in the cluster, with the possibility to filter them by type. Each event type is explanatory, and each event type is marked with the color it is indicated on the map.
Clicking on a event in the overview window will close the window and zoom in the map to the location where the event was triggered.
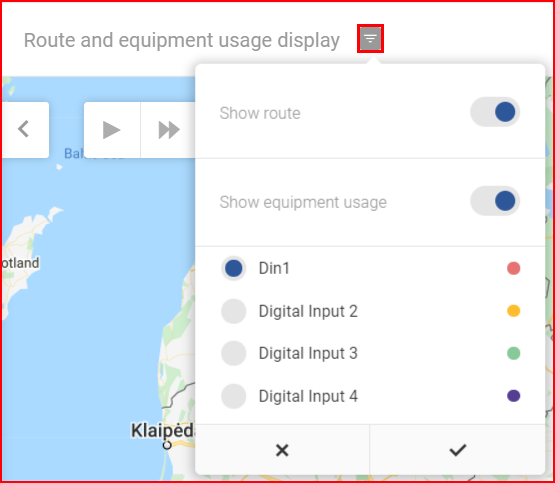
The Route and equipment usage display allows the selection of some parameters to be displayed on the map. Show route shows/hides the light blue line that indicates the route. Show equipment usage opens a list of available equipment usage events. Only one can be selected at a time. Selections will only be applied by clicking the ✓ button. Click ✗ to discard any changes.
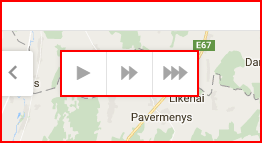
Playback function – On the top left side of the map, there is a mini playback controller. What this does is retraces the path of the vehicles on the map. This will allow the user to see a playback of the vehicles movements on the map. This works in correlation with the details columns, since it retraces every received record, and with every step on the map, a correlating row in the details chart will be highlighted. To start the playback, click the triangle “Play” button, to stop it click the two vertical lines button “Pause”. Additionally the user can speed up the playback with the other buttons, the number of arrows indicates the playback speed, where one arrow indicates 1x speed multiplier, where 3 arrows, means x3 speed. Additionally the user can select from where to start the playback, by clicking a coordinate in the details chart.
Visual graph – displays information in a form of a graph. Parameters can be changed by clicking the three dots on the top left side of the graph. Parameters will differ with every vehicle, depending on the FM device configuration. At least one parameter must be selected and the maximum number of parameters is 4. Color indication will format automatically after changes.
Color indications are displayed above the graph. The x – axis in the graph represents the time (for the previously selected time period), while the y – axis represents the values for each parameter (from lowest – below, till highest – above). Hovering the mouse over the graph will highlight the closes record and the values in that record. The values for the highlighted record are displayed on the y – axis in the middle of the lowest and highest parameters value. The graph can be zoomed into or zoomed out by using the mouse wheel. When zoomed in, the user can navigate through the graph by click and dragging the graph. Clicking on any point in the graph will navigate the map to the spot where these records were made. Clicking one of the two buttons at the upper right corner will switch the graph display between a linear and a nonlinear style.
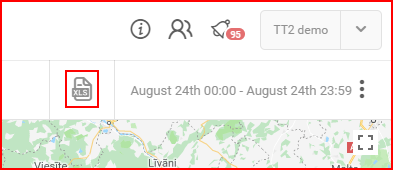
It is possible to export the data for the selected time period by clicking the small “XLS” icon on the top right side of the screen. This will download an excel file containing raw data for the selected vehicle.
An example of the excel file:
